The Crazy Changes In The Washoe Housing Market In 2025
Looking Back At 2025
Transaction Volume
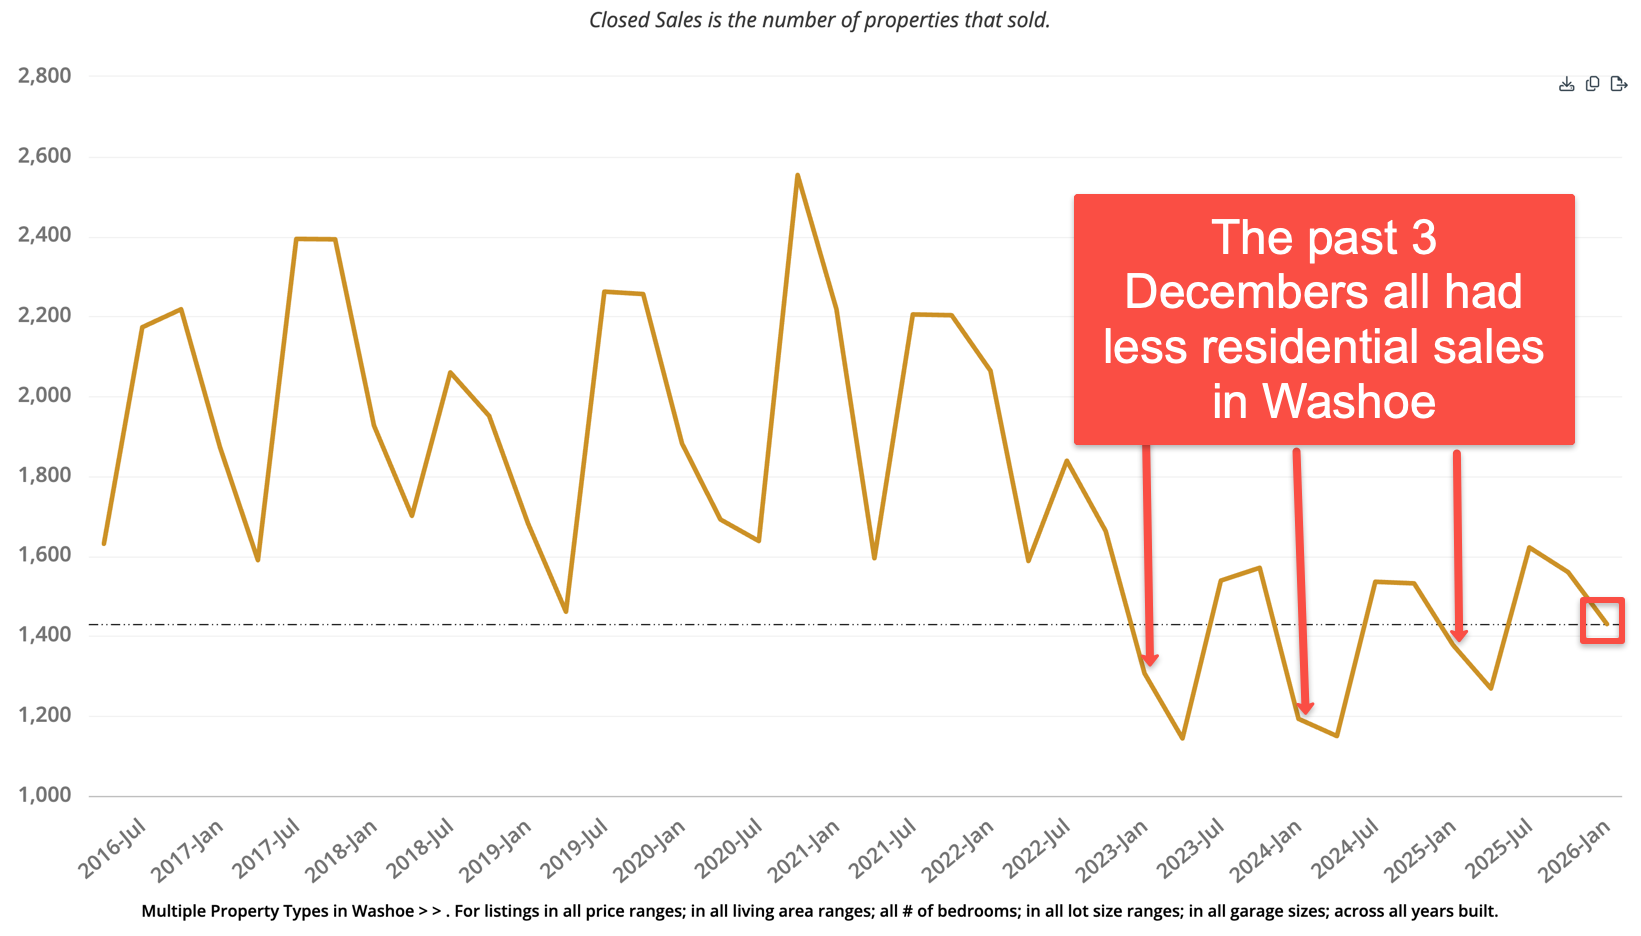
One of the biggest things to note about 2025 and the past few years, is the number of homes sold, which has been significantly lower than previous years
Average number of homes sold:
- Pre-covid (typical market) - 2017-2019: 9667
- During covid - 2020-2021: 10049
- Post-covid - 2023-2025: 7102: 41% lower than covid, 36% lower than pre-covid
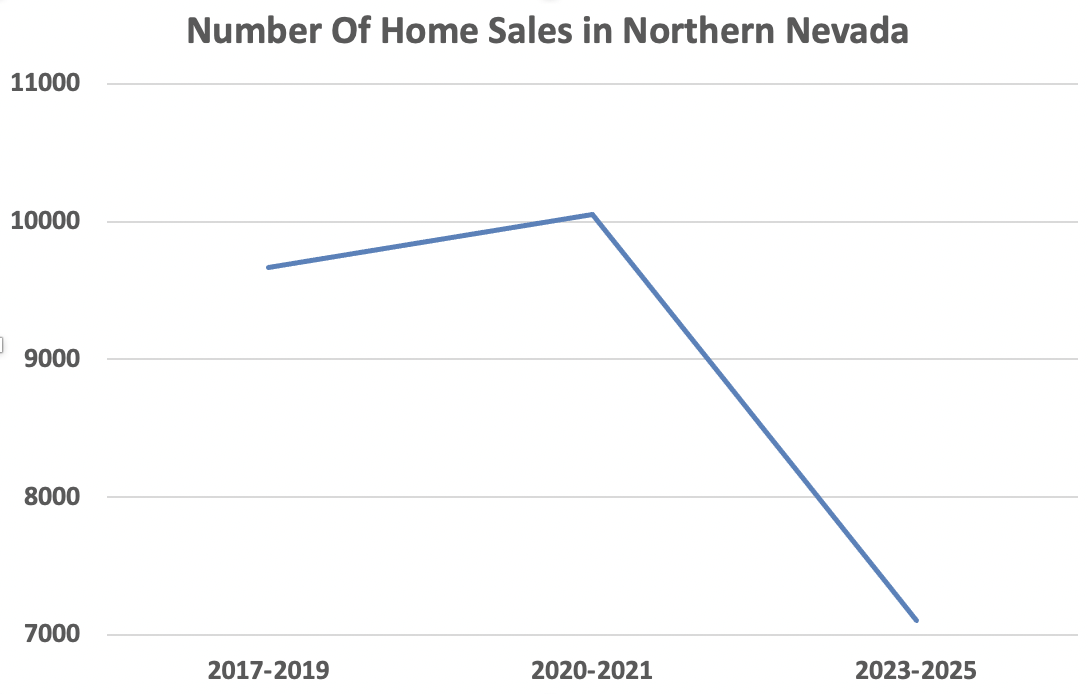
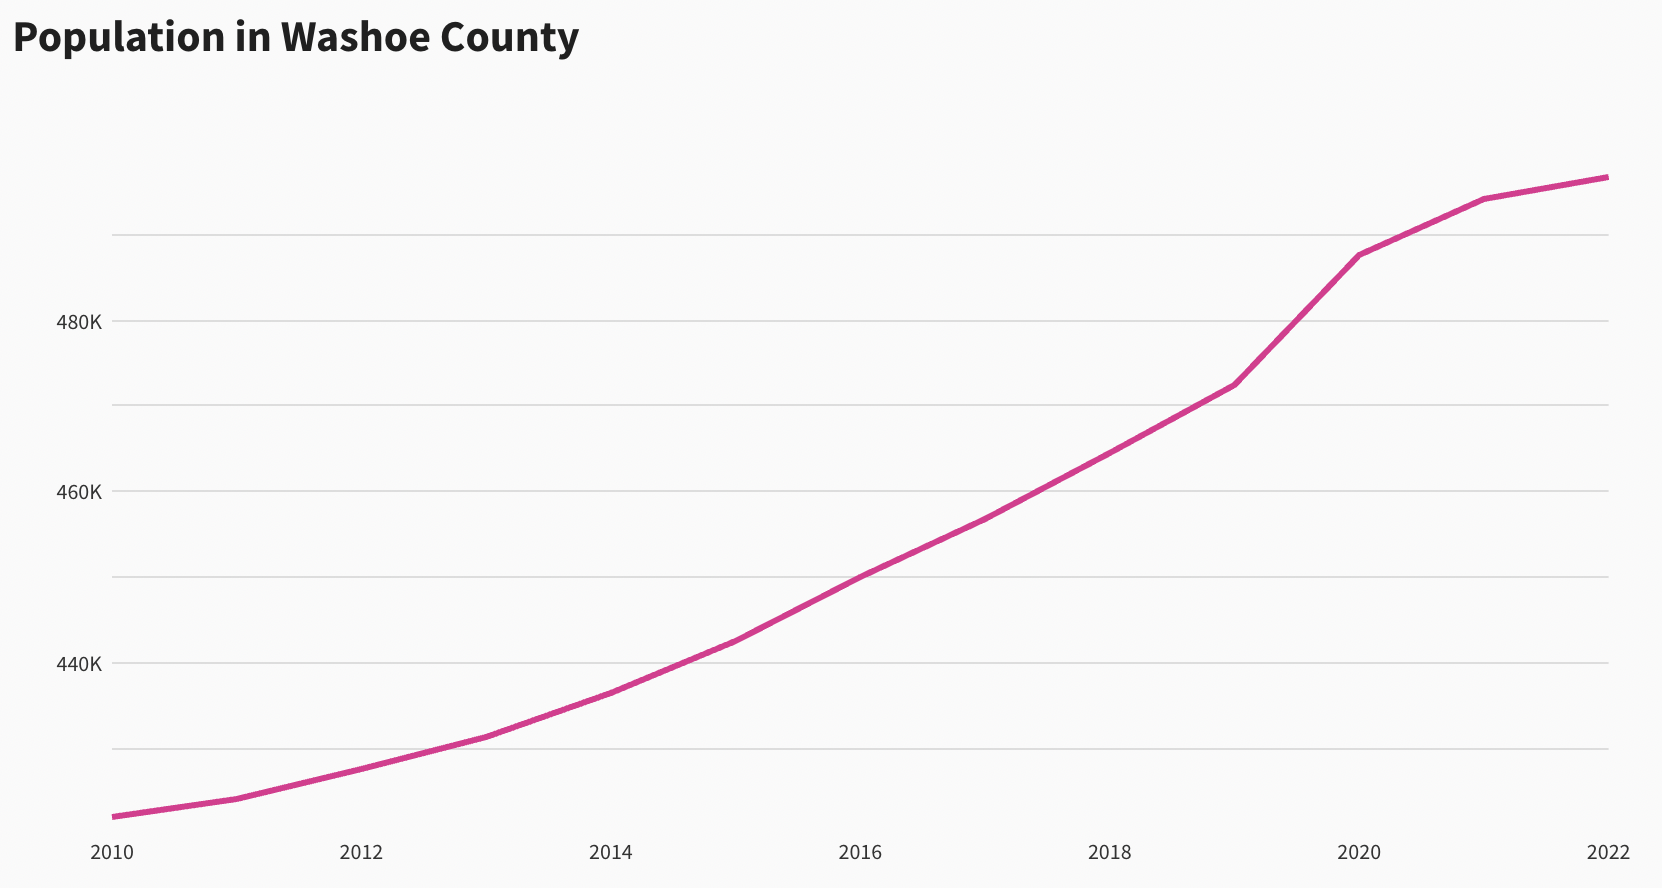
Meanwhile our population in Northern Nevada is up 19% since 2017. So more people, yet fewer homes sold. With 36% fewer people moving in each of the past 3 years, that's almost like saying there's a full year of extra transactions waiting on the sidelines in pent up demand. For people who are staying in a home longer than intended, eventually life is going to catch up. Whether it's due to a new baby, death, marriage, divorce, job change, etc, at some point, moving will be required due to life events.
It's actually a bit of a miracle that the economy is still going. When you consider that: real estate agents, mortgage brokers, title and escrow officers, home inspectors, appraisers, etc... are all making 41% less money for the past 3 years, compared to what they were making in the years prior. For the average household, if you're cutting out 41% of their budget, that's well more than 100% of all discretionary spending. So things like going out to eat get put on hold for those families, which then affects restaurant workers, who then have less for their own discretionary spending, and the cycle continues. This all shows that the economy in Northern Nevada is extremely strong, and diversified, and can continue to thrive in a variety of overall economic conditions.
Distressed Listings
In 2009, at the height of the banking crisis, the percent of homes in Northern Nevada that were sold as a "distressed" sale hit 61% of all sales! A "distressed" sale is being considered as either a Short Sale, HUD Owned, or Real Estate Owned. In 2025, only 1.1% of sales were distressed, the second lowest since we began tracking this in Northern Nevada. This is second only to 2022 when we had the Federal Moratorium on Foreclosures, and even then 1% of sales were still distressed, barely less than we have today.
| Year | Distressed Sales | Total Sales | Percent Distressed |
|---|---|---|---|
| 2025 | 108 | 9641 | 1.12% |
| 2024 | 138 | 9417 | 1.47% |
| 2023 | 126 | 9027 | 1.40% |
| 2022 | 103 | 10523 | 0.98% |
| 2021 | 158 | 13124 | 1.20% |
| 2020 | 218 | 12931 | 1.69% |
| 2019 | 310 | 12459 | 2.49% |
| 2018 | 256 | 11881 | 2.15% |
| 2017 | 593 | 12862 | 4.61% |
| 2016 | 865 | 11926 | 7.25% |
| 2015 | 1242 | 11259 | 11.03% |
| 2014 | 1905 | 10421 | 18.28% |
| 2013 | 3415 | 10617 | 32.17% |
| 2012 | 6053 | 10632 | 56.93% |
| 2011 | 6118 | 10219 | 59.87% |
| 2010 | 5223 | 9253 | 56.45% |
| 2009 | 5308 | 8717 | 60.89% |
| 2008 | 2297 | 6151 | 37.34% |
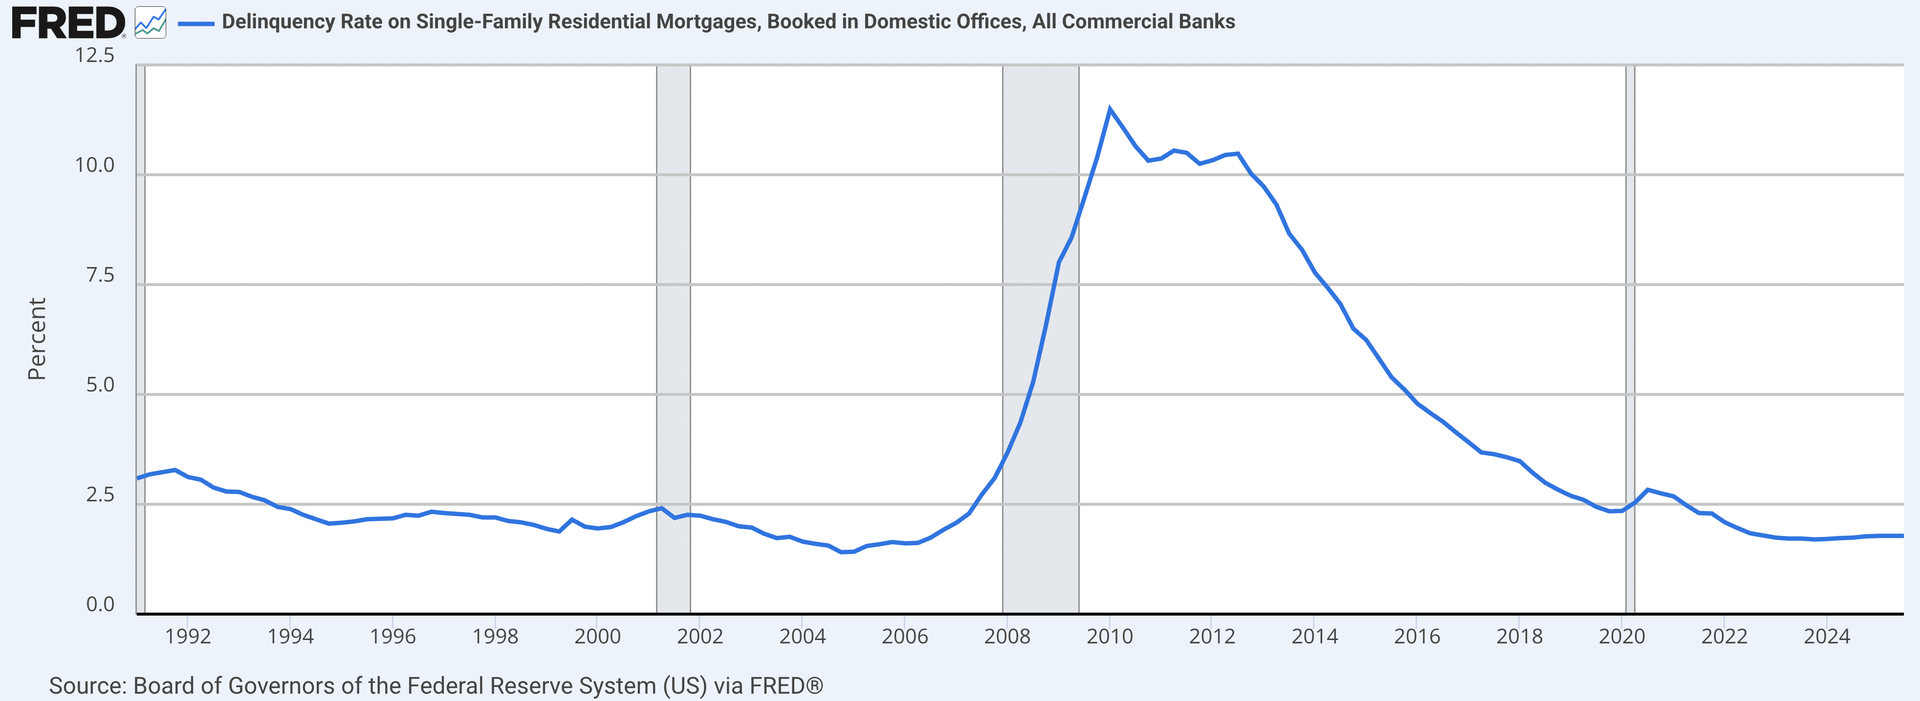
Nationally, the delinquency rate for mortgages is only 1.8%. This is about as low as it has ever been. Most of the 1990s and early 2000s the delinquency rate was higher or equal to the current level before the spike to 11.5% during the banking crisis in 2010. The delinquency rate has steadily improved and leveled off for the past 15 years, and doesn't currently show any signs of reversing and going back up. So if you're waiting for another downturn, you could be waiting a while, because we're not seeing the indicators that we saw last time.
Prices
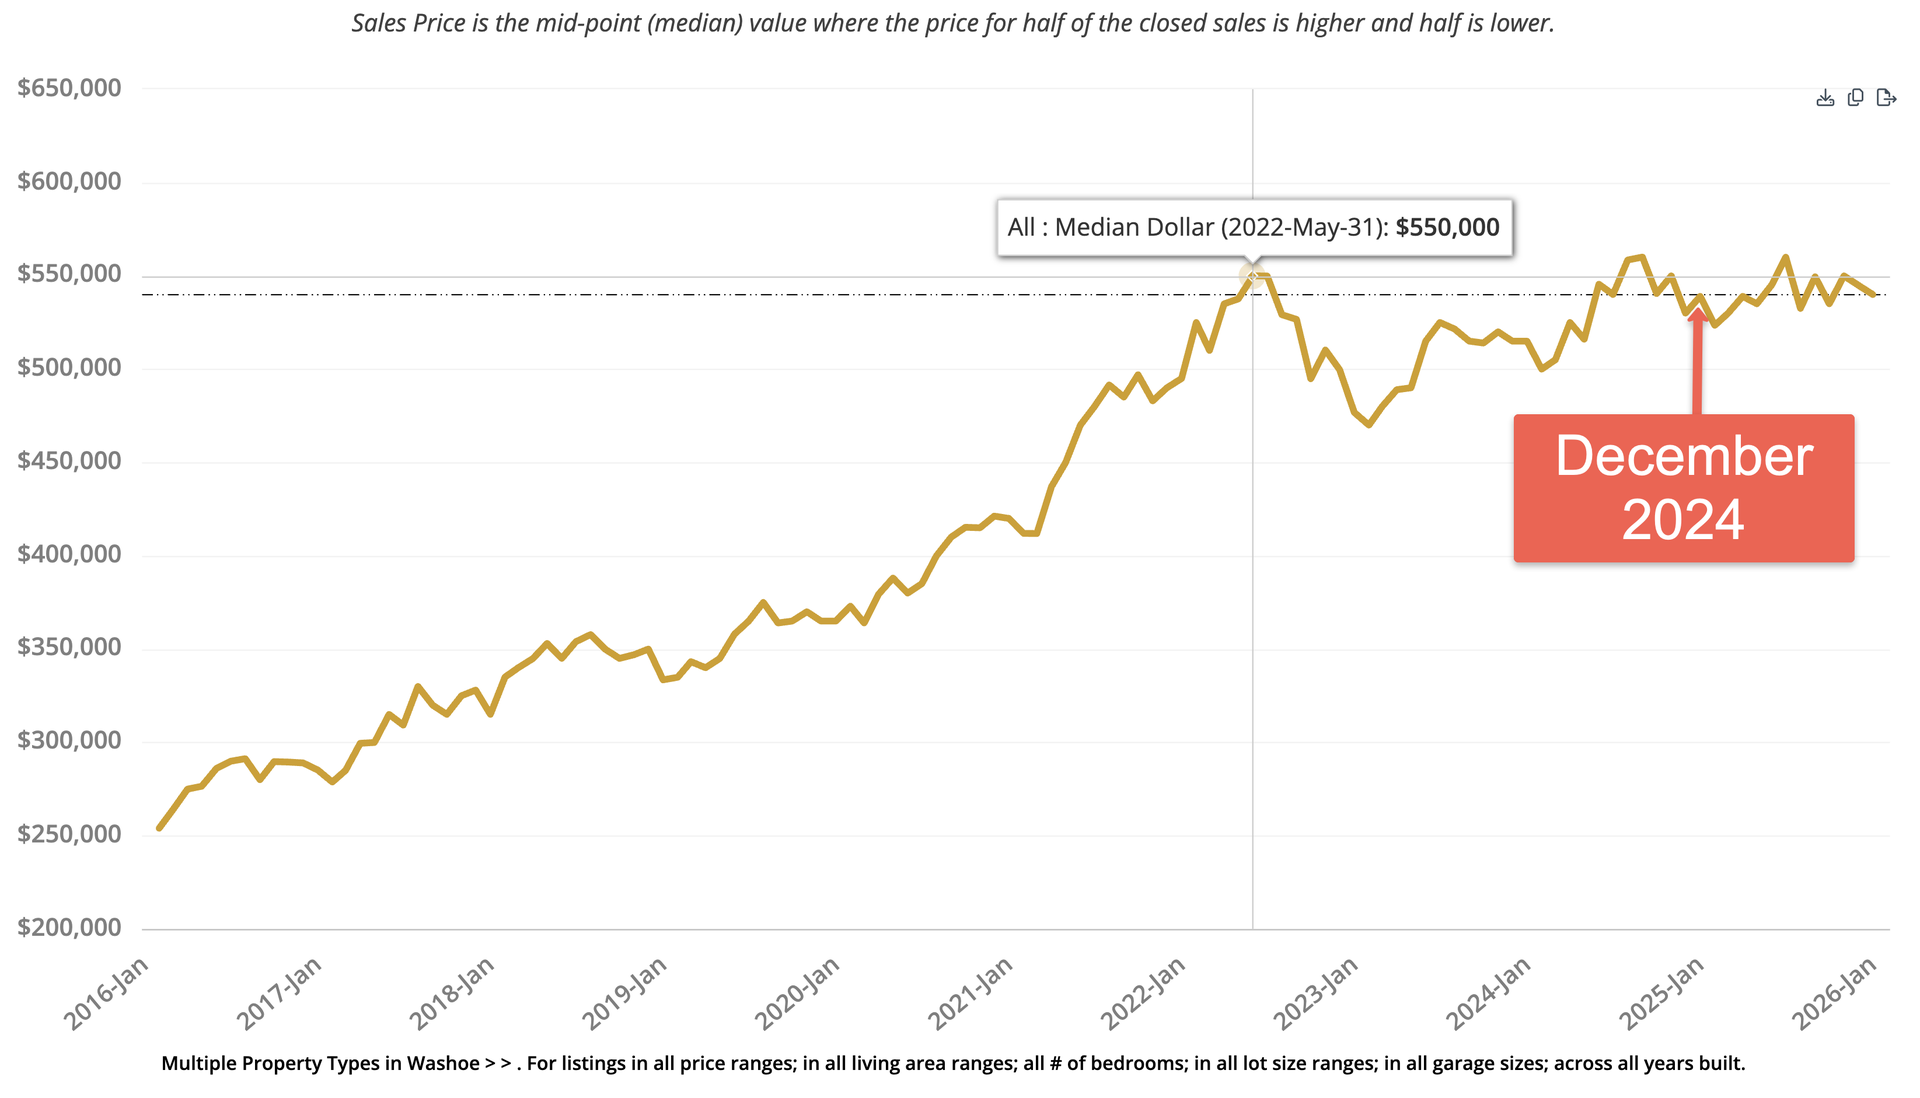
Residential housing prices have wavered quite a bit over the past few years, but have pretty much leveled out. Homes in Washoe County hit a median high price of $550,000 in May of 2022, then had a 15% drop within a year as interest rates quickly rose. Prices are now back pretty much where they were, and are completely flat year-over-year. As always, when drilling down into smaller sections of the market, we can find some opportunities, for example, single-family-homes and condos/townhomes are both below the 2022 highs, but manufactured houses are above the 2022 high. Additionally, older residential properties in Washoe, built before 2000, are currently 21% cheaper than newer homes built after 2000.
A busy Winter
The final quarter of 2025 (October 1 - December 31) was the busiest we've had for years with 1430 residential sales in Washoe County. 4% more transactions than 2024, 20% more than 2023, and 9% more than 2022. This December also had more pending sales than each of the 3 prior years, which should lead to January 2026 having more closed sales than it's had for years.
Anecdotally, the market also 'seems' busier. In December I had 50 showing requests to tour homes, and 15 of those were cancelled because the home immediately accepted an offer within the first day or two of hitting the market. I've also worked on multiple bidding wars. It seems like a lot of homes are sitting, but the best homes that are well priced are going quickly.
Looking Forward into 2026
Home Affordability
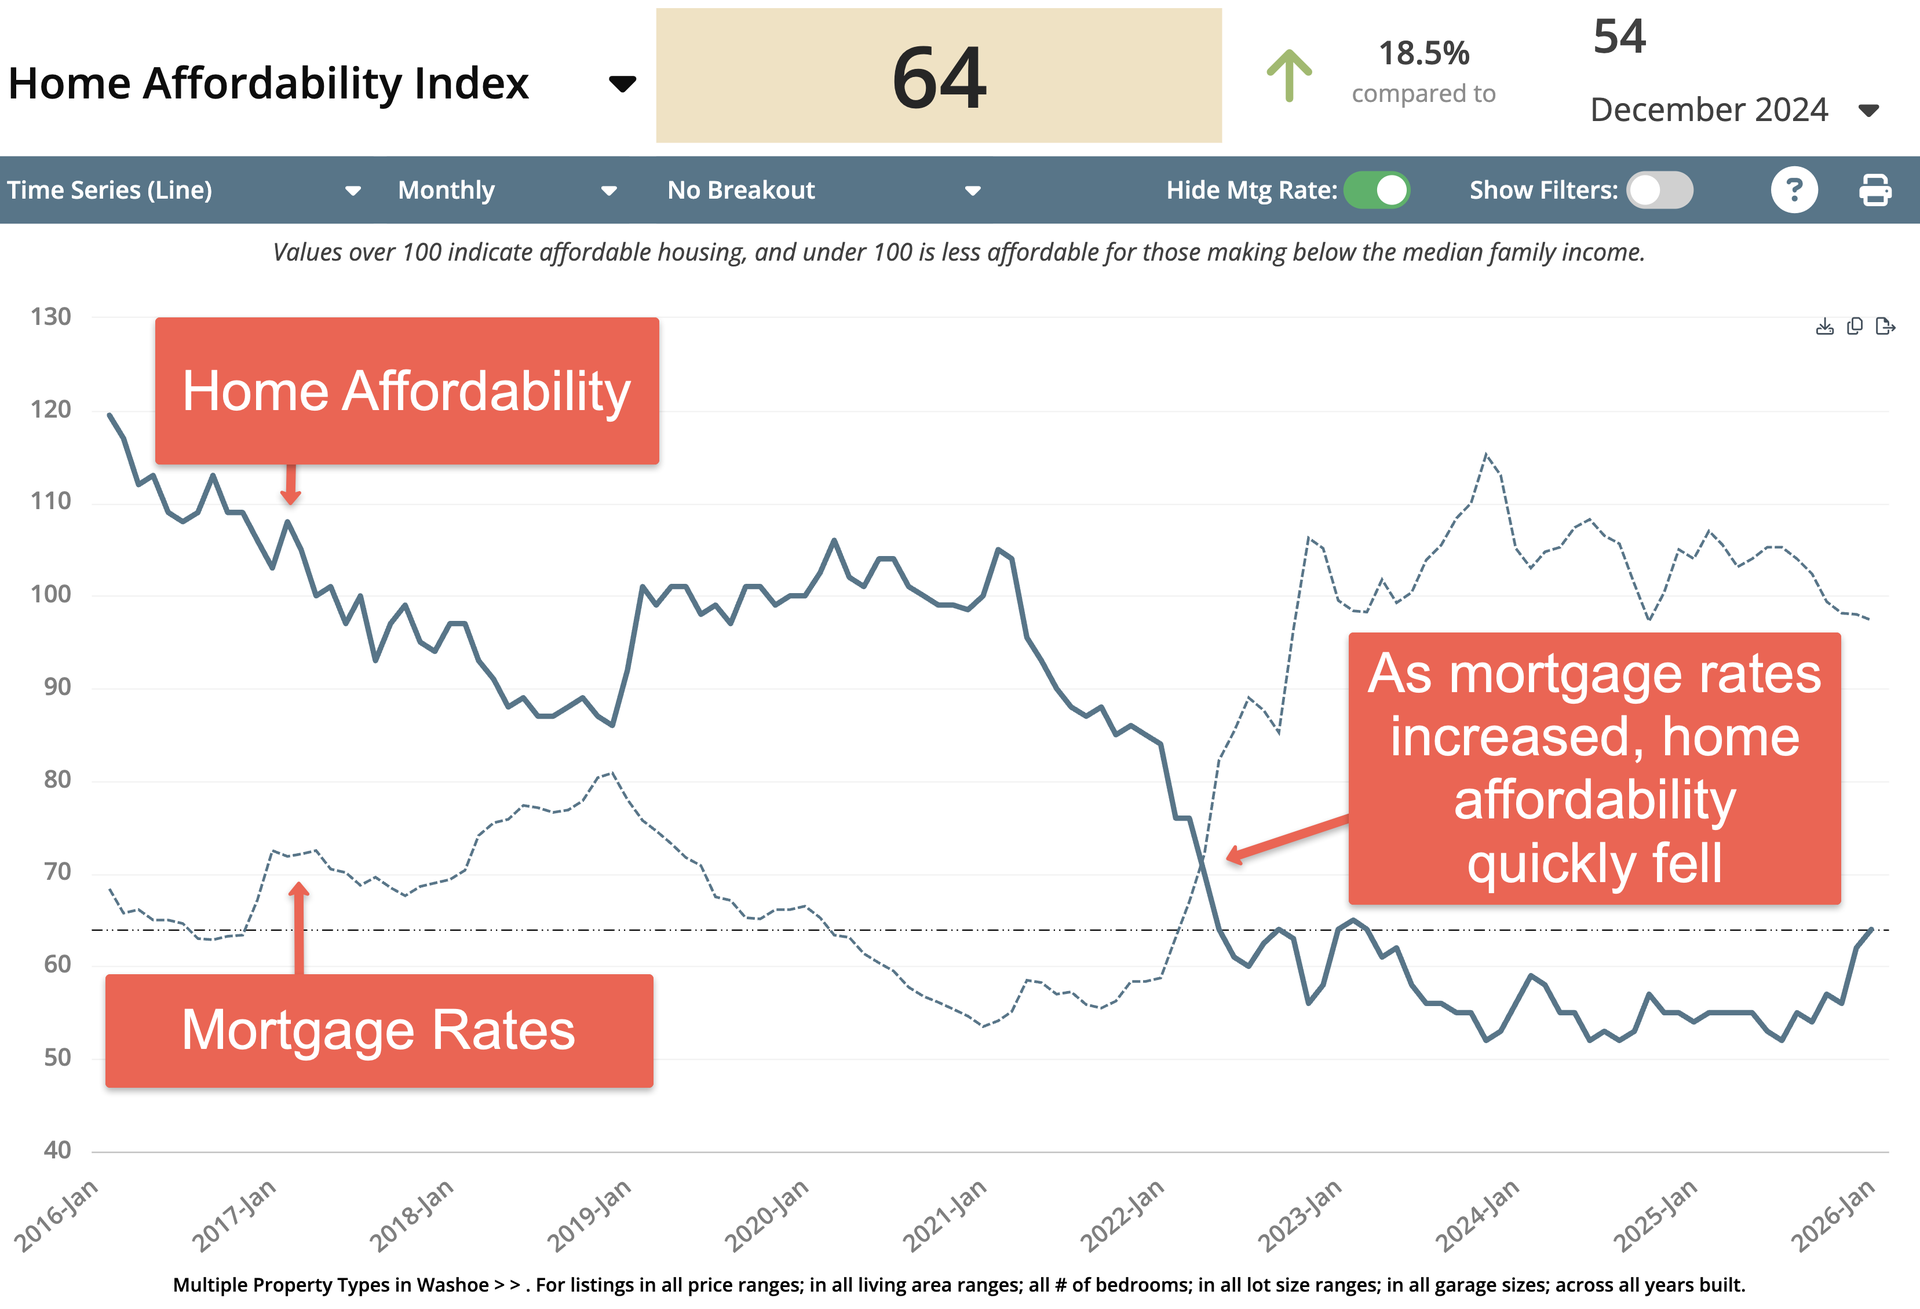
The home affordability index measures how easy it is for a household making the median income, to afford a median priced home. This takes into account current incomes, current home prices, and current interest rates for a mortgage. An affordability index of "100" would mean that someone earning the median income, can afford the median priced home. An index of "50" means that someone earning the median income can only afford half of a median priced home. Affordability has been on a considerable uptrend for the past 6 months, increasing from "52" in June of 2025, to "64" at the end of the year, for all residential housing in Washoe. We've been in the 50s pretty much the entire time since interest rates started to rise in early 2022. As affordability improves, more buyers are likely to enter into the market. The question will then be if supply (home sellers) will increase to match this additional demand (home buyers). If we don't get additional supply, then prices will most likely be pushed further up, especially when we consider the trend for interest rates.
Interest Rates
Despite what some people believe, knowing what interest rates will do in the future isn't magic, and doesn't require a crystal ball. The Federal Reserve (FED) doesn't directly set mortgage rates, but they do have a strong influence on them. The FED regularly publishes a report showing what they plan to do in the future. This is commonly referred to as a 'dot plot' because each member involved in the process is represented as a dot on a chart with where their individual sentiment is. In March of 2022, the dot plot looked like this:
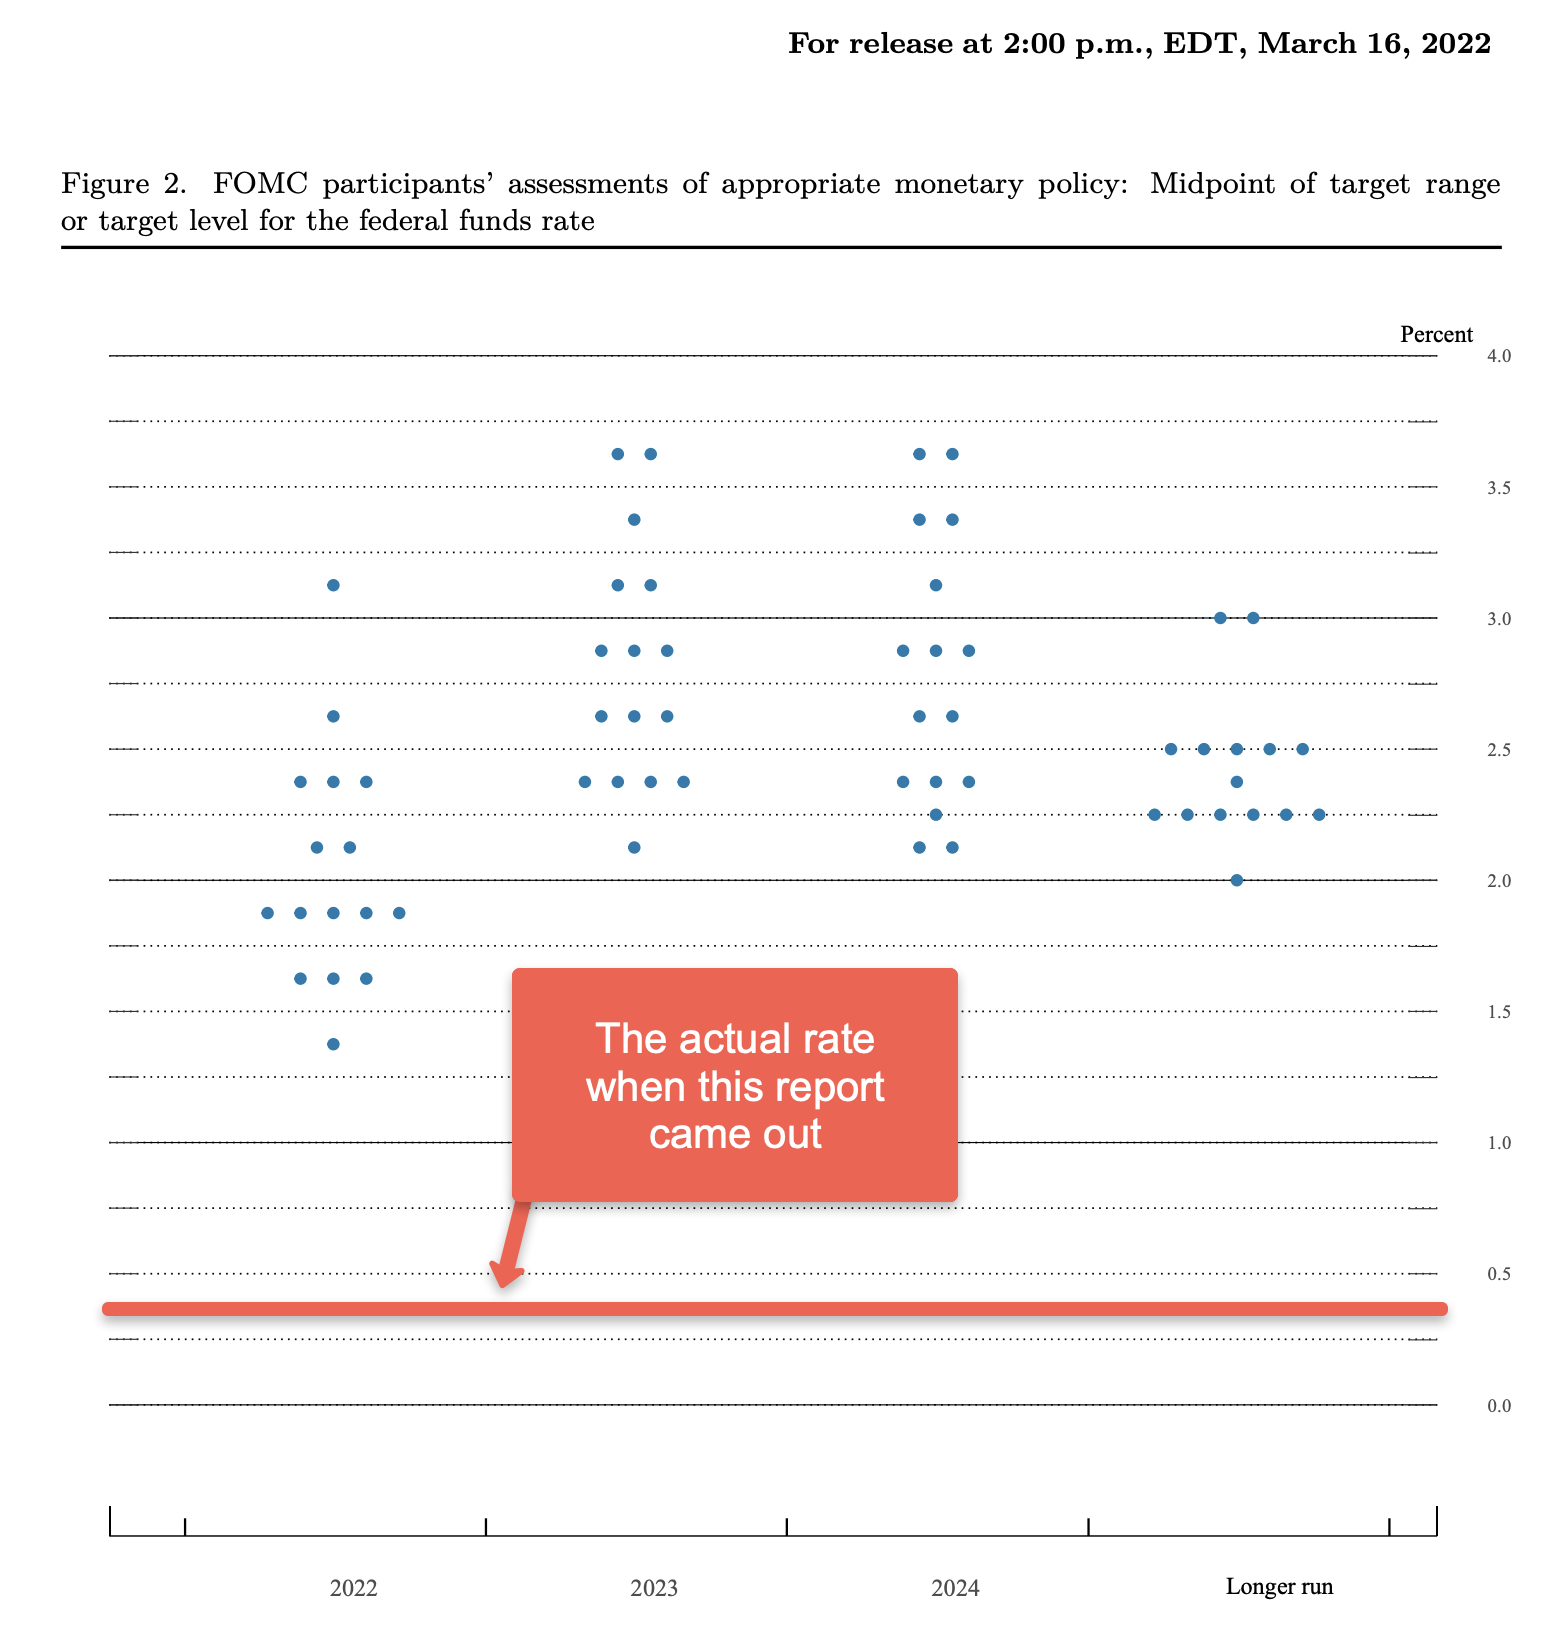
With the red line representing where the rates currently were, and the dots showing where the FED members wanted the rates to be. You can see that there was a very strong consensus that rates needed to go up. This is the most current dot plot:
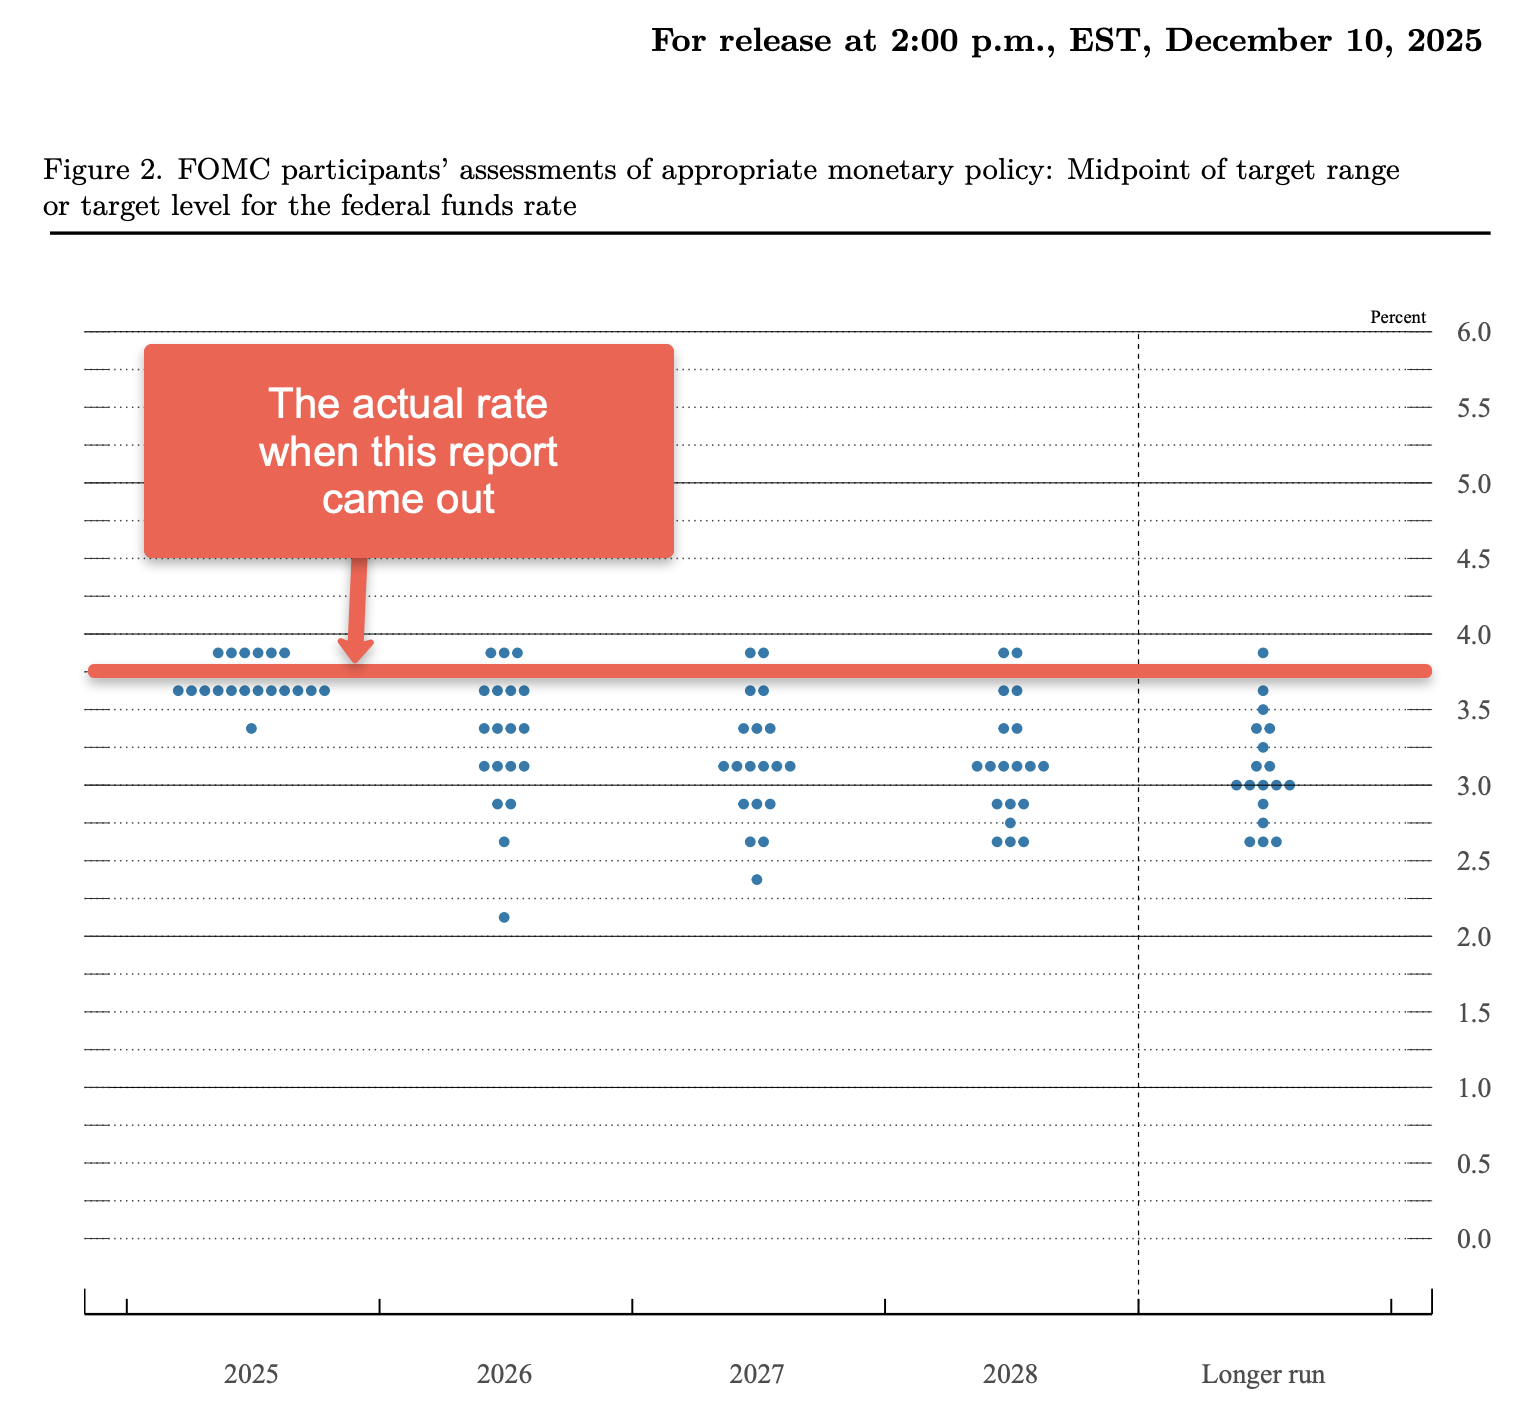
You can see that the general consensus has moved the other way, with it looking very strong that the FED members believe rates should be lower than they currently are. If rates do continue to go down, as they're expected to, and Home Affordability continues to rise, there will be a ton of extra buyers jumping into the market. The question still remains on how this will affect prices, because if home supply stays low, then prices will dramatically increase, but if more sellers do come to the market, then prices may remain more stable.
Transaction Volume (again)
Just to bring everything together full circle, the first thing we looked at was transaction volume, which has been dramatically low for years. This could indicate that there are a lot of sellers sitting in their home, waiting for an opportunity to sell. A lot of potential sellers are in a tough position, because even a lateral move (getting a similar home to the one they're currently in) could result in a mortgage payment that's double what they are currently locked in at. Most households can't afford to double their housing expenses, and the desire to do that for a home that's similar to what they already have is usually pretty low.